Design for Manufacturing (DFM) stands as a foundational discipline in engineering, a proactive approach that consciously guides product designs to optimize manufacturability, assembly efficiency, and overall production economy. In an increasingly competitive global landscape, where consumer demands for innovation, quality, and affordability are relentlessly rising, and time-to-market pressures intensify, the efficacy of DFM directly correlates with a company’s success. Traditional DFM, while valuable, often relies on static rulebooks, expert intuition, and iterative physical prototyping—methods that, though proven, are inherently limited in their scalability, speed, and capacity to address the intricate complexities of modern product development.
The advent of advanced software and sophisticated data collection capabilities, coupled with advancements in computational power and analytical methodologies, has ushered in a transformative era for DFM: the age of data-driven DFM. Integrating analytics into DFM processes is no longer merely advantageous; it has become an essential strategic imperative. Analytics provides the critical lens through which organizations can convert vast quantities of raw design and manufacturing data into actionable intelligence. This intelligence empowers stakeholders—from conceptual designers to production engineers—to make informed, data-backed decisions throughout the entire product lifecycle. By leveraging data, teams can swiftly identify bottlenecks, uncover hidden inefficiencies, predict potential challenges before they materialize, and even prescribe optimal design solutions, thereby mitigating risks and accelerating innovation.
In this blog series, we will delve into the profound impact of analytics on DFM. We will meticulously explore the four distinct yet interconnected pillars of analytics—descriptive, diagnostic, predictive, and prescriptive—elucidating how each contributes uniquely to enhancing manufacturability. We will examine their practical application within the DFM framework, particularly highlighting how specialized tools can serve as catalysts for this data-driven revolution. Furthermore, we will illustrate these concepts through detailed real-world use cases, outline effective implementation strategies, and cast a forward glance at the emerging trends that are poised to redefine the future of DFM analytics, including the integration of artificial intelligence, digital twins, and sustainability metrics. Ultimately, this document posits that investing in DFM analytics is not just a technological upgrade, but also a fundamental shift towards achieving sustainable competitive advantage in the global manufacturing arena.
Please note that this blog series will aim to articulate a forward-looking vision for the future of DFM tools. Some of the techniques discussed are possible today but they may require a combination of general-purpose statistical, analytical, and machine learning tools. However, as customer demand grows, DFM tools are expected to evolve and incorporate these capabilities natively.
Furthermore, deep-dive analyses will likely draw data from multiple sources, necessitating customer-specific approaches due to the diverse ways in which data is currently stored. The pace of tool evolution will be closely tied to customer appetite and the rate of technology adoption. Customers will understandably seek to evaluate the ROI from existing tools before embracing features that are more advanced.
With that context, let us now explore the various dimensions and potential of analytics in DFM.
Descriptive Analytics in DFM: Understanding “What Happened?”
Descriptive analytics forms the foundational layer of data analysis, focusing on summarizing historical and current data to understand past events and present conditions within DFM processes. Its primary objective is to provide clear visibility into design performance, identify compliance with manufacturing rules, and track key metrics, allowing teams to monitor and report on the manufacturability of their products. By answering the fundamental question, “What has happened, and what is happening?” descriptive analytics establishes the baseline for all further analytical endeavors.
Key Components of Descriptive Analytics in DFM
1. Reporting:
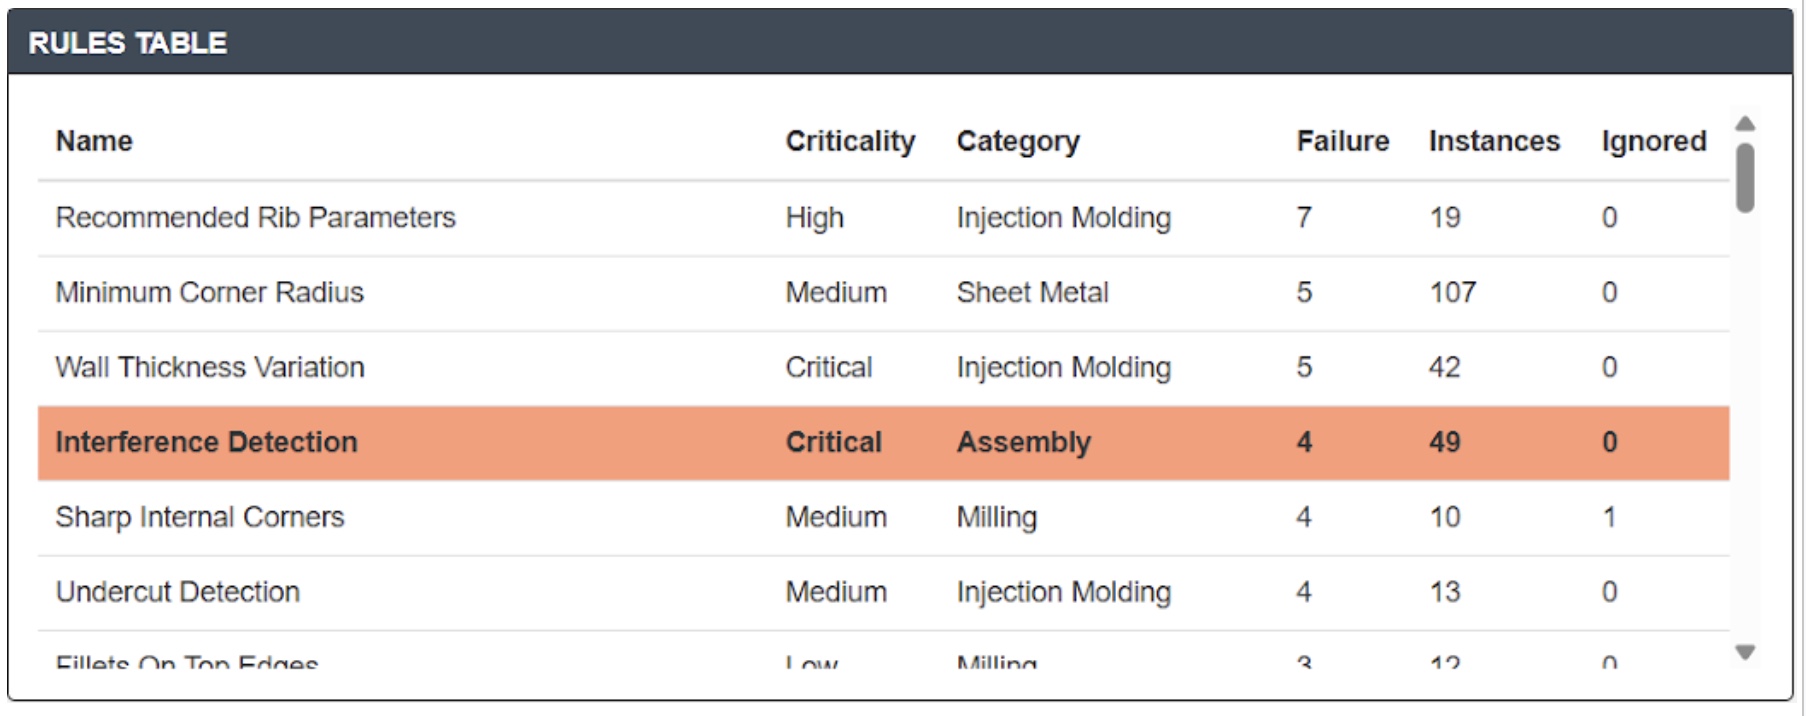
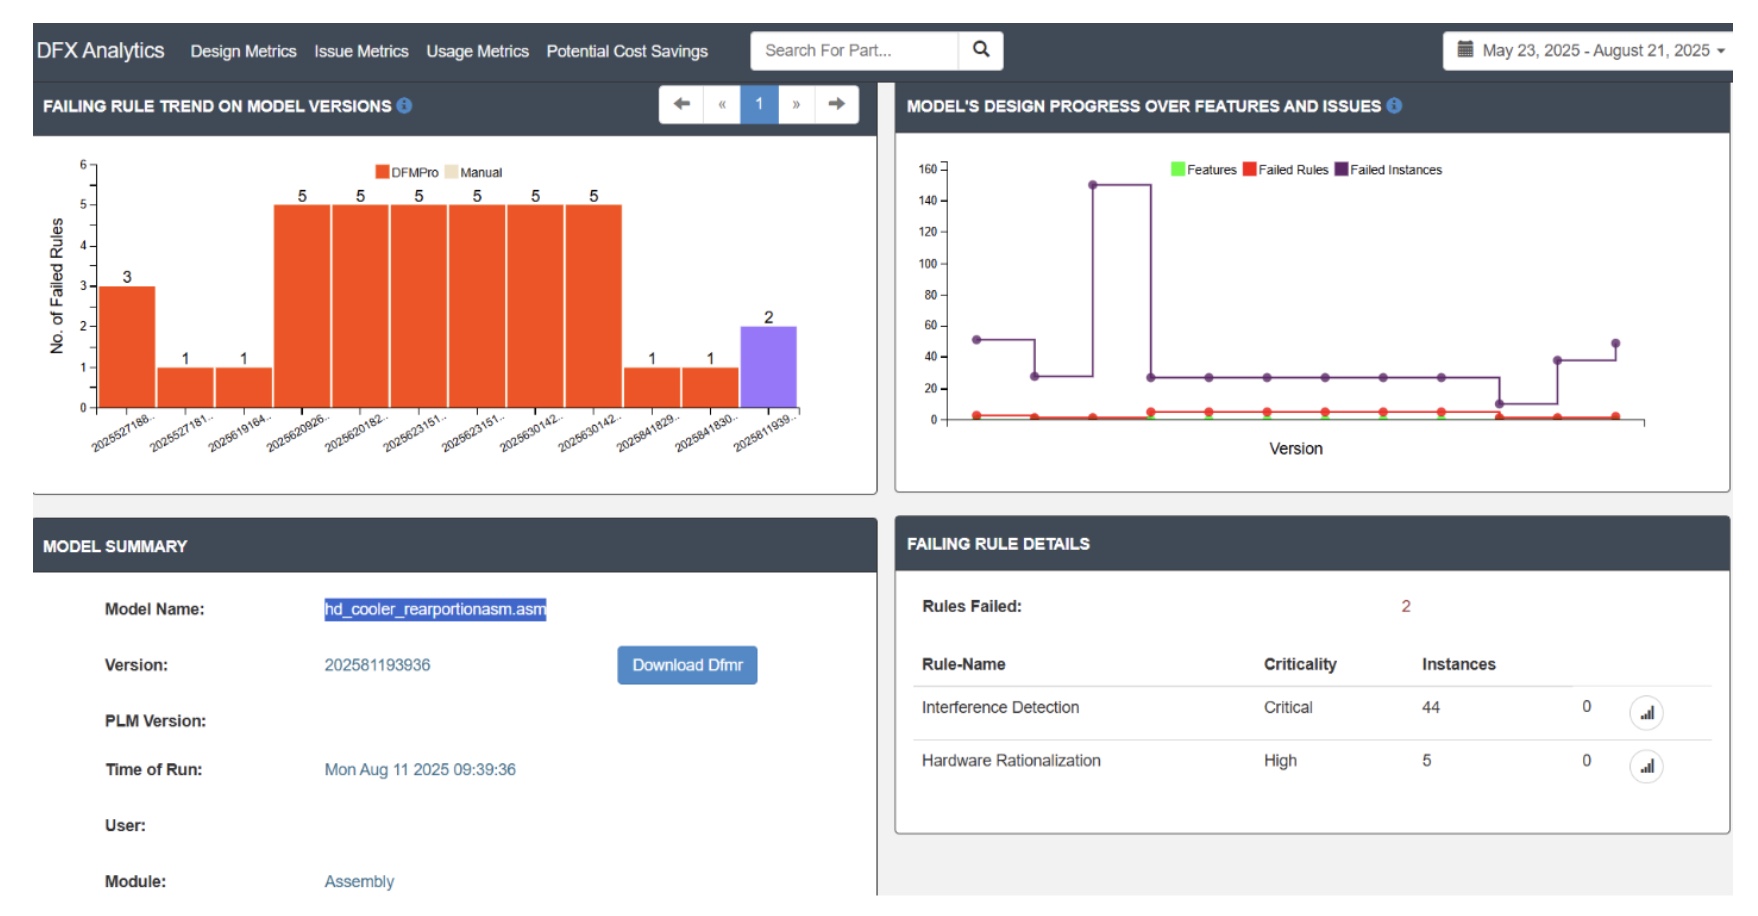
Descriptive analytics heavily relies on comprehensive reporting to present summarized DFM rule violations. These reports can be categorized by violation type (e.g., ‘minimum wall thickness violation,’ ‘tool accessibility issues,’ ‘undercuts,’ ‘sharp corners,’ ‘feature proximity issues’). Reports can detail the frequency of each violation, its severity, and the specific design components or features affected. Beyond simple counts, reports can show trends over time (e.g., how often ‘draft angle’ violations occurred last quarter versus this quarter), compare performance across different product lines, and highlight the “top contributing designs/products” most frequently associated with DFM issues. The goal of these reports is for program managers to stay on top of design issues and design progress towards release-to-manufacturing. The automation of these reports often generated nightly or on-demand ensures that stakeholders have consistent and up-to-date information, eliminating manual data aggregation errors and delays.
2. Dashboards:
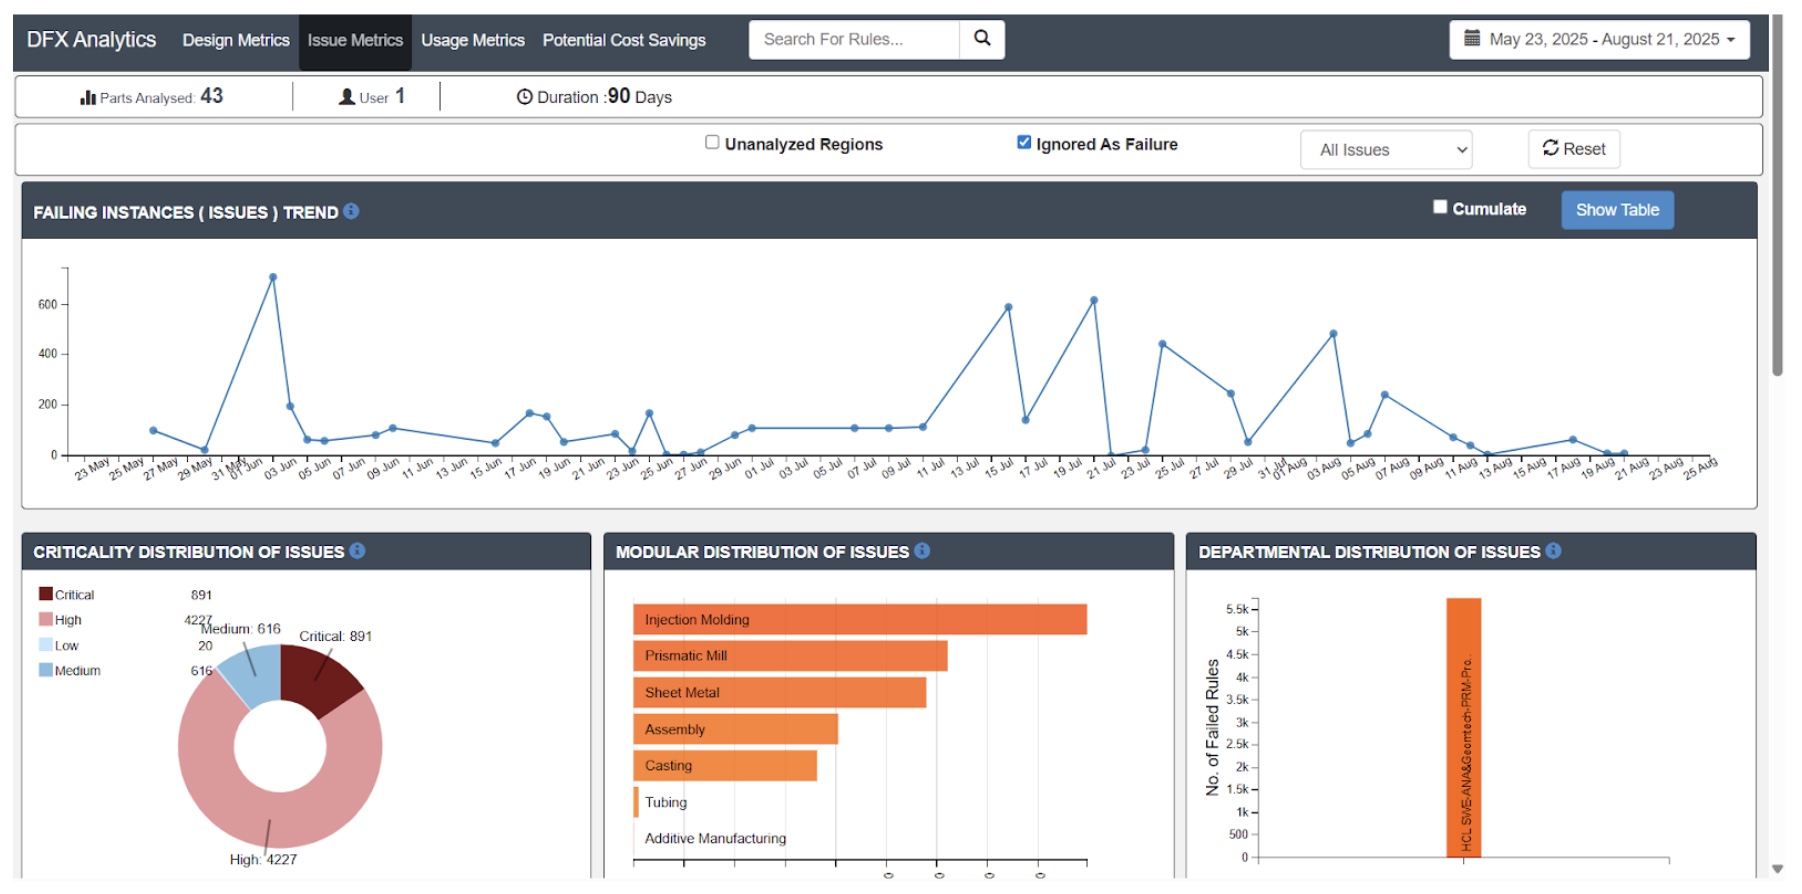
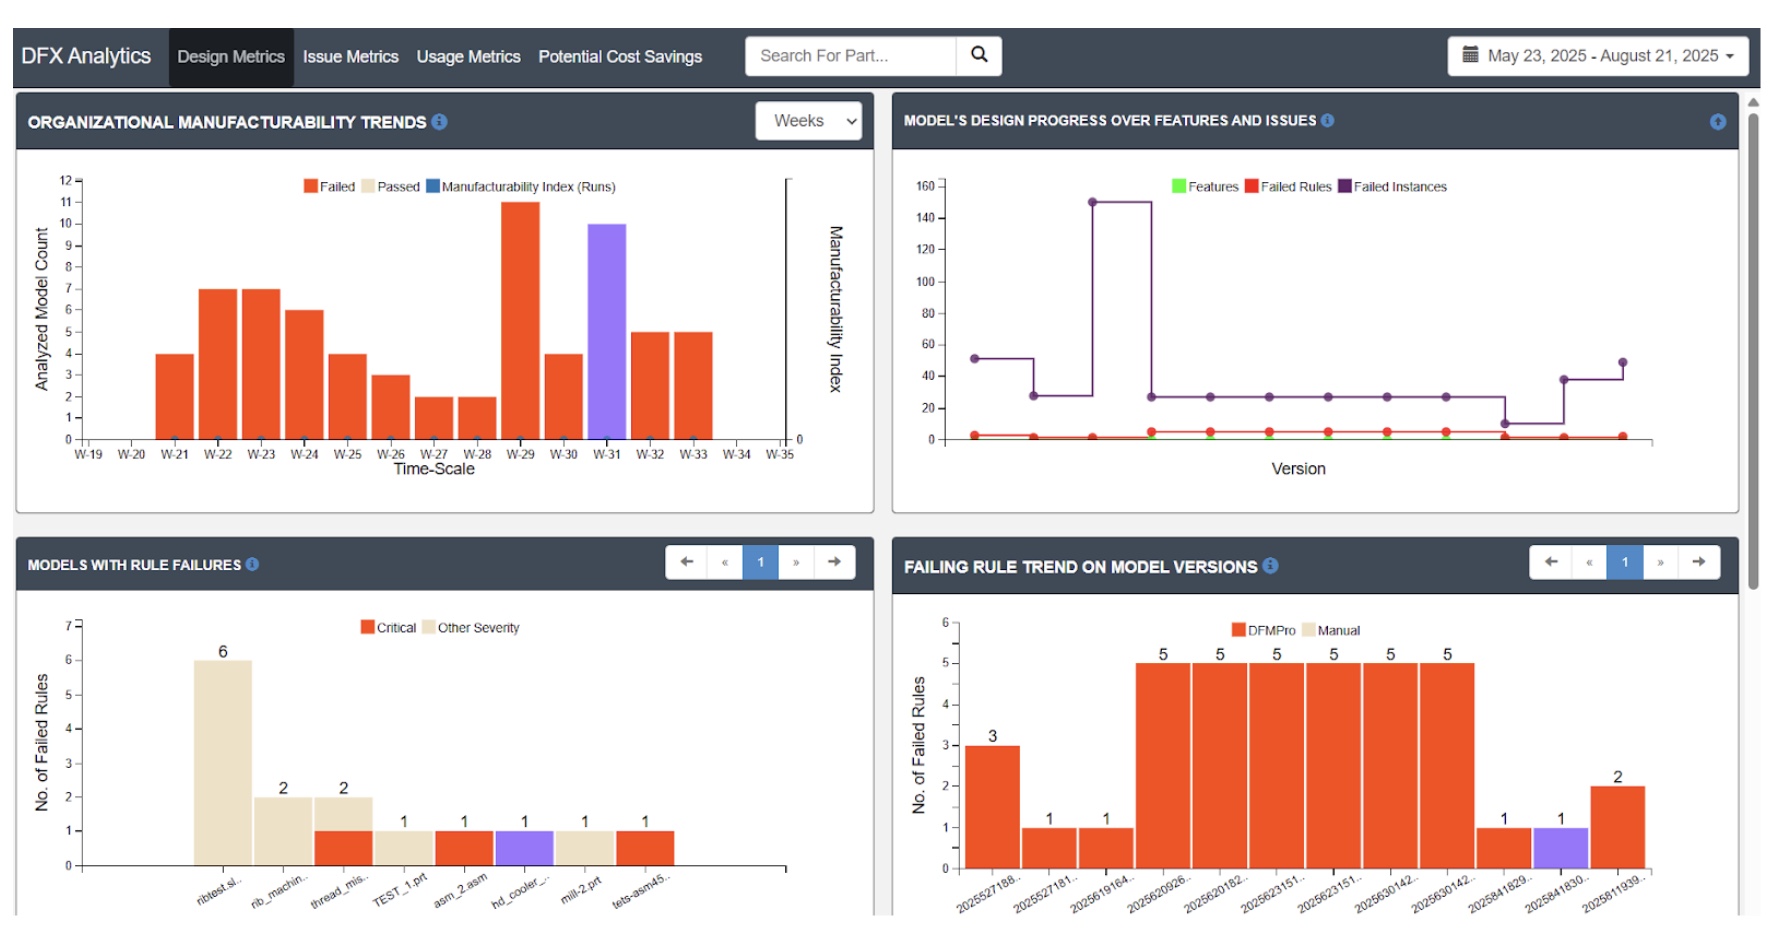
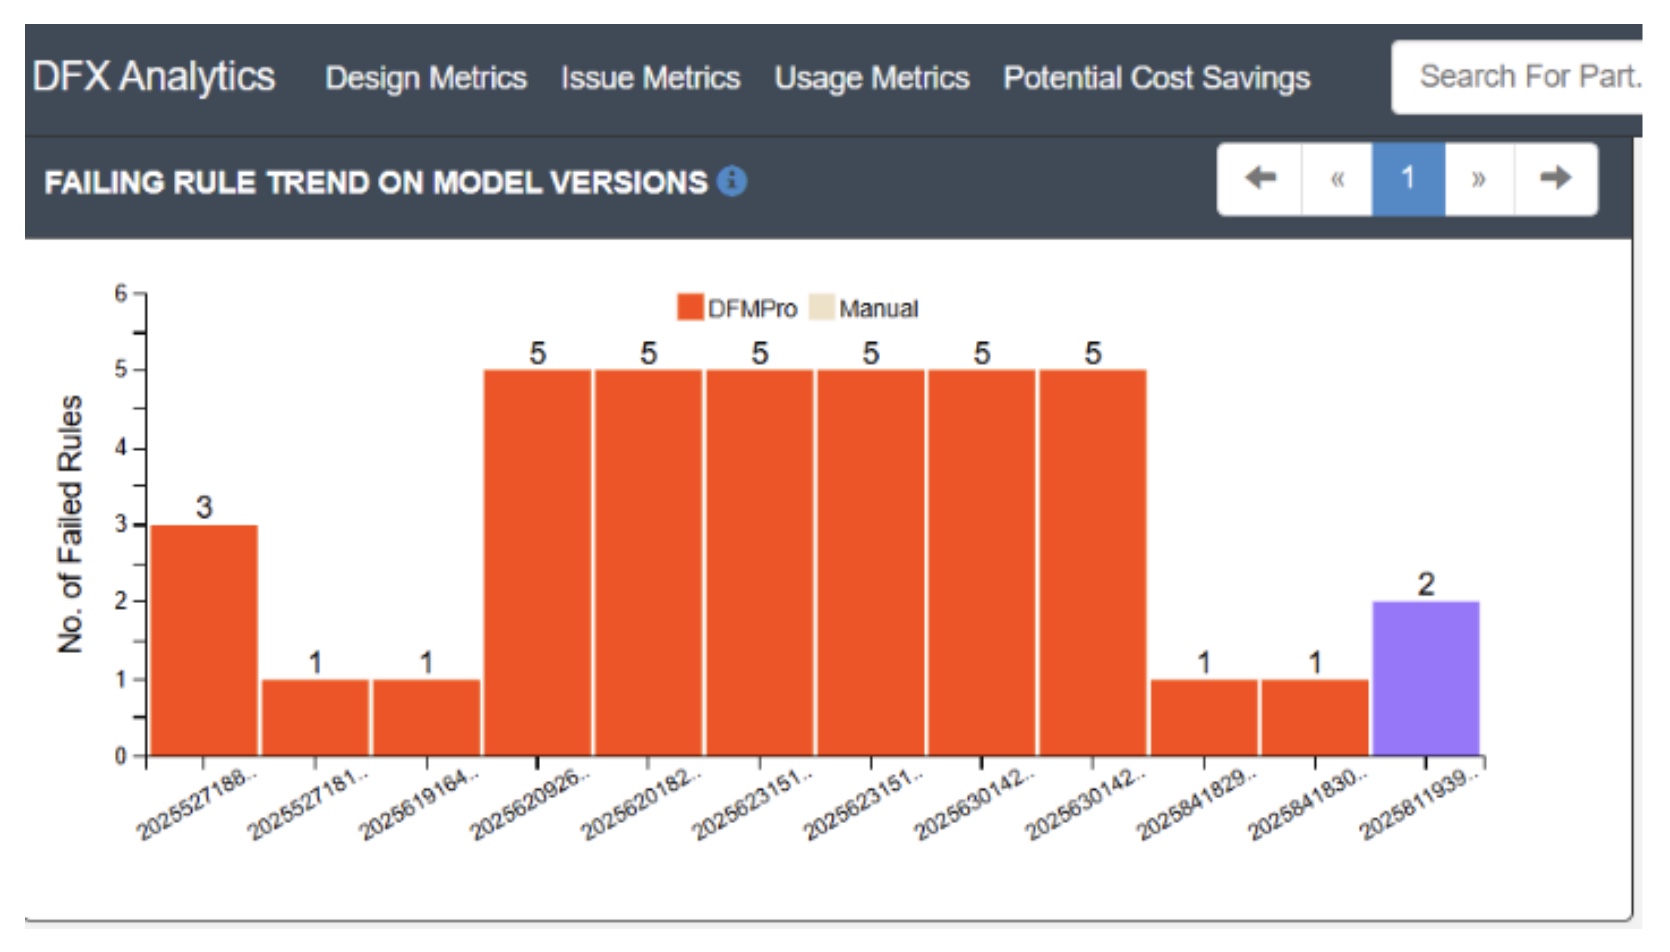
Interactive dashboards serve as the visual nerve center for descriptive DFM analytics. They transform raw data into easily digestible visual representations, such as line charts, bar graphs, pie charts, and heat maps. These visualizations help identify trends in DFM issues over time, making it simple to spot improvements, recurring problems, or emerging patterns. For instance, a dashboard might display a month-over-month trend of DFM issues, categorize issues by manufacturing process (e.g., machining, molding, casting), or show the distribution of issue severity. The power of dashboards lies in their ability to provide an at-a-glance overview for management while offering drill-down capabilities for engineers to explore specific areas of concern. They foster a common operational picture across design and manufacturing, promoting data literacy and shared understanding.
3. Performance Metrics:
A robust descriptive analytics framework defines and tracks critical performance metrics that quantify DFM effectiveness. These metrics move beyond simple rule counts to measure the impact and efficiency of the DFM process itself.
- First-Pass Yield (FPY) DFM: This metric measures the percentage of designs that pass DFM checks without requiring any rework or significant iterations. A high FPY indicates efficient initial design and adherence to manufacturing guidelines. Tracking FPY over time reveals the effectiveness of DFM training, rule refinements, and design tool improvements.
- Average Resolution Time for DFM Issues: This metric quantifies the time taken from the identification of a DFM violation to its successful resolution by the design team. A decreasing trend suggests improved efficiency in addressing issues.
- DFM Issue Density/Rate: Measures the number of DFM violations per design, per component, or per unit of design complexity (e.g., lines of CAD). This helps benchmark design quality.
- Cost of Non-Conformance (CoNC) related to DFM: While often-requiring diagnostic elements, descriptive analytics can quantify the visible costs associated with DFM issues that made it through design—e.g., cost of rework, scrap, late design changes, or expedited manufacturing.
- Iteration Count for DFM Compliance: Tracks how many design iterations or review cycles are needed on average for a design to become fully compliant with DFM rules. Lower counts indicate more efficient design processes.
4. Compliance Reports:
Beyond internal performance, descriptive analytics may generate reports that document adherence to external manufacturing standards, regulatory guidelines (e.g., ISO, industry-specific standards), and internal company-specific best practices. These reports may be required in certain organizations for demonstrating due diligence, preparing for audits, and ensuring that products meet all necessary quality and safety criteria before entering production or market. They provide an auditable trail of DFM activities and compliance checks.
Benefits of Descriptive Analytics in DFM
- Improved Visibility into Design Quality: Descriptive analytics pulls back the curtain on design processes, revealing not just if designs pass DFM checks, but how well they perform against manufacturability criteria, highlighting areas of excellence and areas needing improvement.
- Enhanced Accountability: By clearly defining and tracking metrics, teams can be pushed to attain high standards for the DFM performance of their products. This transparency encourages adherence to guidelines and continuous skill development. The goal is to provide feedback for improvement and build a positive momentum towards attaining product and company goals.
- Better Communication across Design and Manufacturing Teams: Shared dashboards and standardized reports provide a common language and objective data points for discussions between design, engineering, and manufacturing. This reduces ambiguity and fosters collaboration.
Challenges of Descriptive Analytics in DFM
- Data Fragmentation across Tools: Design data often resides in CAD systems, DFM analysis results in specialized DFM software, manufacturing data in MES/ERP, and project data in PLM. Integrating these disparate data sources into a unified view for descriptive analysis is a significant challenge, often requiring complex Extract, Transform, Load (ETL) processes.
- Limited Integration with Legacy Systems: Older, on premise systems may lack modern APIs or data export capabilities, making it difficult to pull the necessary historical data for comprehensive descriptive analysis. This necessitates custom connectors or manual data entry in some cases, leading to potential inaccuracies.
- Difficulty in Standardizing Metrics across Product Lines: Different product lines within an organization may have unique manufacturing processes, materials, and DFM considerations, making it challenging to define universally applicable performance metrics. Establishing a governance framework for metric definition and consistent data collection is crucial.
- Data Quality and Completeness: The accuracy of descriptive analytics is entirely dependent on the quality and completeness of the underlying data. Missing data points, erroneous entries, or inconsistent data formats can lead to misleading insights (“garbage in, garbage out”). Ensuring data integrity through validation and cleansing processes is paramount.
These challenges can be overcome if the organization is aligned and focused on the end objectives of DFM performance improvement, which is finally helping the organization achieve product success. One can realize that the alternative is status quo, which will not at all help organizations move forward with their ever-increasing business targets.
We will continue to explore Diagnostic, Predictive and Prescriptive Analytics in DFM in the next three parts of this blog series.